From Data to Harvest: Building an AI-Powered Crop Yield Prediction System
An end-to-end AI crop yield prediction system built with XGBoost and SHAP. Discover how I processed 50,000 records, achieved a 0.9165 R² score, and navigated real-world deployment challenges to launch a live Streamlit dashboard.
 Nilay Naha
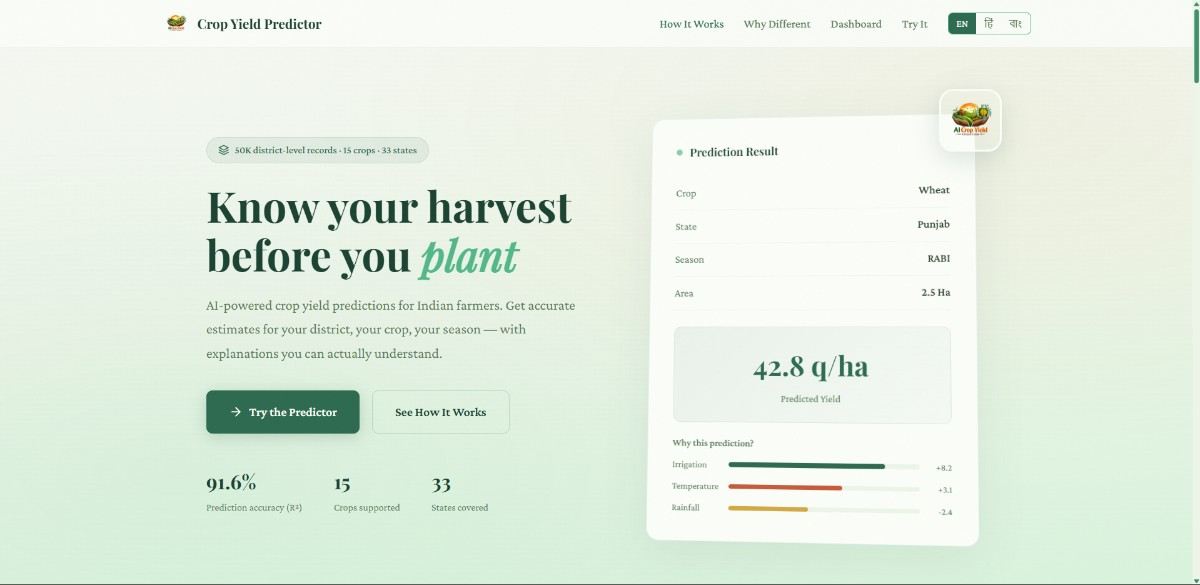
Agriculture is the backbone of the Indian economy, yet predicting crop yields is hard because of the sheer number of variables involved. As a Computer Science and Engineering (AIML) graduate (Class of 2026), I wanted to apply machine learning to exactly this kind of real-world problem — so I built an AI-Powered Crop Yield Prediction System that forecasts output across 15 crops, 33 Indian states and 6 seasons.
Python XGBoost SHAP scikit-learn Streamlit
You can try it and read the code here:
- Live Dashboard: Streamlit App
- GitHub Repository: AmiNilay/Crop-Yield-Prediction-System
The data and architecture
The foundation is a dataset of 50,000 district-level records. Raw crop data alone isn't enough for accurate predictions, so I engineered a pipeline to enrich it with external factors:
- Weather data: integrated via the NASA POWER and Open-Meteo APIs.
- Irrigation data: sourced from the Agriculture Census.
- Fertilizer usage: sourced from the Dept. of Fertilizers.
The tech stack
- Languages and libraries: Python 3.11, XGBoost 3.2, scikit-learn 1.7.2, Plotly
- Explainability: SHAP 0.51
- Deployment: Streamlit 1.60 on Streamlit Cloud
Model training and pipeline
The system takes 11 input features — 3 categorical and 8 numerical. A ColumnTransformer with OneHotEncoder and StandardScaler expands them into 59 encoded features.
For the predictive engine I chose an XGBoost Regressor. I tuned its hyperparameters with GridSearchCV: 3-fold CV across 16 combinations, for 48 fits in total.
learning_rate=0.1, max_depth=5, n_estimators=100, subsample=0.8So the model isn't a "black box", I integrated SHAP (SHapley Additive exPlanations). Users can see exactly which features — rainfall, fertilizer and so on — are driving the prediction for their specific input.
Results and performance
The model explains over 91% of the variance in crop yields.
| Metric | Value |
|---|---|
| R² Score | 0.9165 |
| RMSE | ~25–30 q/ha |
| Training Time | ~90 seconds (48 CV folds) |
| Inference Time | <100ms per prediction |
The real engineering: challenges and lessons
Building the model was only half the battle. Deploying it taught me a lot about production ML systems. Three hurdles stood out.
1. The pickle versioning trap
My cloud deployment crashed with a cryptic 'SimpleImputer' object has no attribute '_fill_dtype' error. The root cause was a version mismatch: scikit-learn 1.7.2 locally versus 1.9.0 in the cloud.
requirements.txt — .pkl files are highly version-sensitive.2. Feature count mismatches
At one point the model rejected inputs because the pipeline produced 62 features instead of the expected 59. Two different scripts were fitting the ColumnTransformer independently, creating different one-hot categories depending on the data split.
The fix: I wrote a rebuild_schema.py script that strictly reads the existing preprocessor without refitting it.
3. The silent .gitignore
My Streamlit app couldn't find the preprocessor — preprocessor.pkl was being caught by .gitignore. Debug logging helped me track it down, and a quick git add -f solved it.
What's next
An R² of 0.9165 is strong, but there's room to improve. My V2 roadmap:
- Granular data: move from state-level to district-level weather using NASA POWER's 0.5° grid data, and add ICAR soil data (pH, organic carbon) to reduce RMSE by another 10–15%.
- Ensemble modeling: stack XGBoost with LightGBM and CatBoost to push R² closer to 0.93.
- Satellite integration: use Sentinel-2 NDVI data (10m resolution) for mid-season yield revisions.
- API development: wrap the inference engine in a FastAPI REST endpoint for easier integration with government or advisory platforms.
- Uncertainty quantification: implement quantile regression to give confidence intervals (e.g. "25.66 ± 4.2 q/ha").
Key takeaways
- Enriching crop records with weather, irrigation and fertilizer data is what makes the predictions useful.
- SHAP turns an XGBoost model from a black box into something users can reason about.
- Pin exact library versions — pickled models break on version drift.
- Fit preprocessors once and reuse them; never refit in separate scripts.
- Check
.gitignorewhen deployed artifacts mysteriously go missing.
This project bridged the gap between theoretical machine learning and practical, deployable software engineering. It was a fitting capstone to my AIML studies, and I'm excited to keep iterating on it.